Texting is biggest cause of road rage
- Details
- Published on Wednesday, 13 May 2015 17:25
- Written by PRNewswire
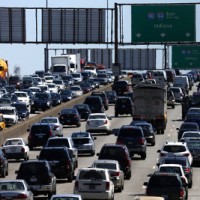
Once again, people who text while driving are the biggest problem for other drivers, according to the 2015 Road Rage Report from Expedia.com.
“The Texter” generated the most rage for the second consecutive year, earning the scorn of 26 percent of those surveyed, according to the yearly analysis of driving etiquette. The study was commissioned by Expedia® and conducted by GfK, an independent global market research company. Among other queries, GfK asked 1,000 Americans to rank the behavior of their fellow motorists in order of aggravation.
"The Tailgater" (13 percent) ranked second, narrowly edging out "The Left Lane Hog" (12 percent), "The Crawler" (10 percent) and "The Multitasker" (7 percent).
The full Expedia 2015 Road Rage Report, as well as an illustrative infographic, can be found at Expedia.com.
"Memorial Day is the unofficial start to summer, and a moment when millions of drivers will take to the road," said John Morrey, vice president and general manager, Expedia.com. "Now that drivers can book rental cars through Expedia's updated mobile app, we've set out with the Road Rage study to examine what sorts of behavior make travel more pleasurable, and what sorts of behavior should be avoided. The study demonstrates that travelers, whether they're on the road or in the air, expect – and reward – courtesy and respect from their fellow travelers."
The least popular in-car behavior is "back-seat driving," cited as the top peeve by 52 percent of Americans. The "Reluctant Co-Pilot" – the co-pilot who won't help navigate – ranked second, by 12 percent of Americans, followed by the "Radio Hog" (10 percent), the "Snoozer" (8 percent), the "Shoe Remover" (7 percent) and the "Snacker" (6 percent).
Americans: Drive As I Say, Not As I Do
Fifty-one percent of Americans report that they loathe sharing the road with bad drivers, more than cyclists, buses, taxis, joggers and walkers combined. Nearly all Americans (97 percent) rate themselves as "careful" drivers, but feel that only 29 percent of fellow drivers merit the description.
Sixty-one percent admit to speeding, while 29 percent admit to following other vehicles too closely. Twenty-six percent have yelled or used profanity at another driver. Seventeen percent have made a rude gesture, but 53 percent have been on the receiving end of one. One quarter of Americans admit to "regularly or occasionally" talking on their mobile phone while driving.
Americans offered multiple reasons for driving misbehavior: 21 percent reported that they were running late. Fourteen percent felt provoked by other drivers and 13 percent felt triggered by another driver who wasn't paying attention.
Four percent of Americans report having exited their vehicle to angrily engage with another motorist, and 13 percent of Americans have felt physically threatened by another driver. The news was not all dire: 40 percent of Americans did report having stopped to help another driver in distress.
New York City Drivers Rank As Nation's Rudest
Among major cities, New York City was cited as having the rudest drivers according to 42 percent of Americans. Thirty-two percent chose Los Angeles drivers, 18 percent felt the nation's rudest drivers could be found in Chicago, while 16 percent said the same of Washington, DC. Only 1 percent of Americans felt that Portland, Oregon drivers were the nation's rudest.
Apps and the Open Road
One out of five Americans have downloaded apps specifically to use while driving. Somewhat surprisingly, nearly one third (32 percent) of Americans report that they still typically rely on written/printed directions when driving, versus apps, and dashboard GPS or their vehicle's navigation system. Google Maps was the clear favorite, preferred by 35 percent of Americans. Twelve percent of Americans rely instead on Apple Maps.
Eighty-three percent of Americans have used a map app while in the car. Forty-six percent have used a traffic app. Thirty-eight percent have used a music app, and have also used weather apps. Thirty-five percent of driving Americans have used an app to find a restaurant, 28 percent to find a gas station, and 16 percent to find a hotel.
Gas Price Predictions and Attitudes towards Rental Cars
Additional findings from the Expedia 2015 Road Rage Survey include:
- 64 percent of Americans believe gas prices will rise this summer, versus 12 percent who believe they will fall.
- Nearly 40 percent of Americans would refuse to drive in a country, such as England, where motorists use the opposite side of the road.
- 25 percent of Americans have rented a car within the past year. 26 percent have never rented a car at all.
- 80 percent of Americans typically rent cars for leisure purposes. The most important feature in a rental car decision is price (cited by 76 percent of Americans).
- 10 percent of Americans "strongly or somewhat agree" with the statement that they are "more likely to break the law in a rental car than in their own car."
The complete list of Road Rage etiquette violators follows:
- The Texter (26%)
- The Tailgater (13%)
- The Left-Lane Hog (12%)
- The Crawler (10%)
- The Multitasker (7%)
- The Drifter (7%)
- The Inconsiderate (6%)
- The Swerver (5%)
- The Speeder (4%)
- The Unappreciative (3%)
- The Honker (2%)
- The Red Light Racer (1%)
About the Survey
The study was conducted online using the GfK "KnowledgePanel," an online probability-based panel designed to be representative of the US general population, not just the online population. The study consisted of approximately 1,065 interviews conducted between April 3 - 5, 2015 among adults aged 18+ with a valid US driver's license. The margin of error is +/-3 percentage points.


