'The Texter' incites the most road rage, survey reveals
- Details
- Published on Friday, 16 May 2014 16:20
- Written by PRNewswire
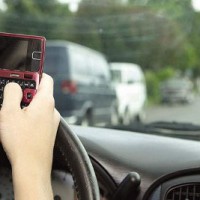
Most Americans rate texting while driving as the most aggravating driver behavior, according to the 2014 Road Rage Report released Friday by Expedia.com®.
The report is based on results of a survey conducted on Expedia's behalf by Northstar, which asked 1,001 adult Americans to identify the behaviors that are likeliest to elicit road rage, from texting to swerving to speeding and beyond.
With the Memorial Day weekend just ahead, when more than 30 million Americans are likely to take to the roads, courteous and respectful driving behavior will be at a premium.
On the whole, distraction is the most infuriating feature of the American driver, the report said. People who text while driving incur the most anger: 69 percent of Americans rate "The Texter" as the most aggravating driving behavior, followed by "The Tailgater" (60 percent), "The Multi-tasker" (54 percent), "The Drifter" (43 percent) and "The Crawler" (39 percent).
Nearly 7 in 10 Americans (69 percent) report having been "flipped off" by a fellow motorist, while only 17 percent have admitted to doing so themselves.
"As the unofficial start of summer, Memorial Day sees a huge spike in the number of drivers on the road," saidJohn Morrey, vice president and general manager of Expedia.com. "Expedia rents millions of cars to Americans, so we set out to learn what behaviors on the open road are most welcome, and what behaviors most aggravating. The rule, as with airplanes and hotels, is that shared spaces demand decorum and attentiveness."
The full list of driving behaviors ranked as "most annoying or offensive" includes (percentage identifies behaviors ranked in the top five):
|
· The Texter (drivers who text, email or talk on a phone while driving): |
69% |
|
· The Tailgater (drivers who follow others far too closely): |
60% |
|
· The Multi-tasker (applying makeup, eating, reading, etc.): |
54% |
|
· The Drifter (either straddling two lanes or weaving between them): |
43% |
|
· The Crawler (driving well below the speed limit): |
39% |
|
· The Swerver (failing to signal before changing lanes or turning): |
38% |
|
· The Left-Lane Hog (drivers who occupy the passing lane without moving): |
32% |
|
· The Inconsiderate (those who do not let others merge): |
30% |
|
· The Speeder (driving well past the speed limit at length): |
27% |
|
· The Honker (drivers who slam the horn at will): |
18% |
|
· The Unappreciative (drivers who do not give a wave or gesture of thanks): |
13% |
|
· The Red Light Racer (drivers who inch ever closer to the light when red): |
12% |
A full analysis of Expedia's 2014 Road Rage Report can be found at http://viewfinder.expedia.com/.
Additional findings
- Despite the fact that Americans identify texting as the most offensive driving violator, 55 percent of Americans do admit to using their mobile phone at least some of the time while driving. In addition, 70 percent of Americans also admit to having been guilty of aggressive driving behavior, including speeding (58 percent), tailgating (28 percent) and yelling and/or swearing at fellow drivers (28 percent). Men are only slightly more likely to admit to aggressive driving than women (74 percent to 67 percent).
- The rudest drivers are found in the largest cities: 33 percent of Americans name New York City as home to the least courteous/most rage-inducing drivers. 71 percent of Americans put New York among the top five rudest driving cities. Los Angeles (22 percent) ranked second, while Atlanta (9 percent) came in third. Only 5 percent of Americans believe Boston features the country's rudest drivers, but 27 percent of Americans place Boston in the top five.
- American drivers do regularly demonstrate courtesy and helpfulness. The survey said 55 percent of American drivers report that they have stopped to help a fellow motorist – one they did not know – in distress. That behavior grows likelier with age: 42 percent of those aged 18-34 report having done so, versus 59 percent of those aged 35-54 and 64 percent of those 55 and older.
- Gas Price Pessimism vs. Open Road Optimism: Americans are generally pessimistic as it relates to gas prices: 96 percent believe gas prices will rise this summer. Even so, 56 percent define a road trip as an ideal way to spend a vacation and 30 percent have taken an overnight road trip in the past 12 months. More than a third of Americans (36 percent) have rented a car in the past 12 months, with most of them (70 percent) renting for leisure.
- The Expedia 2014 Road Rage Report found that 61 percent of Americans claim to treat their rental cars better than they treat their own cars; 19 percent claim to treat rentals worse. And 92 percent of Americans say they always refill the gas tank before returning a rental.
- Price is the most important feature in a rental car, with 62 percent ranking it as most important. Size is the second most important feature, followed by rental type (convertible, SUV, sedan or other), style (standard versus premium/luxury) and brand. Of those surveyed 42 percent claim that they always rent the same type of car. When Americans invest in rental car upgrades, they are likelier to do so when they are renting a car for business (52 percent) than for leisure (42 percent).
- Mobile apps have replaced printed maps. The Road Rage Report revealed that mobile phone maps – Google / Apple maps among them – are the most popular source of driving directions, with 40 percent of Americans using them regularly. Another 35 percent rely on dashboard GPS systems, while 22 percent still use printed maps.
- Among the 76 percent of Americans who own and regularly use an app-enabled mobile device, more than 4 in 10 (42 percent) have downloaded an app specifically to use while in the car. Among road-trip-related apps, Americans place the most value on maps (63 percent), traffic notification (47 percent) and weather alert / driving conditions (44 percent). Mobile devices are also popular for accommodations, with 23 percent of U.S. drivers using their mobile device to search for a hotel.
- 62 percent of Americans believe 16 is too young to drive.
- 17 percent of U.S. drivers have driven in a foreign country on the opposite side of the road; 66 percent would do so while 34 percent would not.
- 91 percent of American men and 57 percent of American women claim to know how to change a tire.
- 85 percent of American drivers are "always pleasantly surprised" to receive a wave of thanks from a fellow driver.
- The two most popular reasons to honk at a fellow motorist are "if a driver starts to drift into my lane or is about to cut in front of me" (78 percent) and "when another driver cuts me off" (52 percent).
- 62 percent of Americans prefer "the scenic route" to the fastest route when driving on vacation.
- "Spouse/partner" is the favored road trip companion for 68 percent of Americans, followed by best friend (31 percent), children (29 percent) and dog (14 percent).
- "Chips" are the top road trip snack for 36 percent of Americans, followed by"Fast food" (31 percent), "Nuts or dried fruit" (31 percent), "Candy" (29 percent), "Beef jerky / pepperoni sticks" (25 percent).
- The Pacific Coast Highway is the preferred scenic route for 41 percent of American road trippers, followed by Route 66 (33 percent listed in the top 3), Overseas Highway / Florida Keys (28 percent) Hawaii Belt (27 percent), Blue Ridge Parkway (26 percent).
- Classic rock is the preferred road trip music for 40 percent of Americans, followed by country (28 percent), Golden Oldies (25 percent), top hits (24 percent), pop (23 percent), easy listening (22 percent), Hip Hop (15 percent), and heavy metal (10 percent).


