July 26: Anniversary of the Americans with Disabilities Act
- Details
- Published on Friday, 25 July 2014 15:33
- Written by PRNewswire
On July 26, 1990, President George H.W. Bush signed the Americans with Disabilities Act, which prohibits discrimination against people with disabilities in employment, transportation, public accommodations, commercial facilities, telecommunications, and state and local government services.
Population Distribution
56.7 million
Number of people in the United States in 2010 with a disability. People with disabilities represented 19 percent of the civilian noninstitutionalized population. Persons with a disability have a physical or mental impairment that affects one or more major life activities, such as walking, bathing, dressing, eating, preparing meals, going outside the home, or doing housework. A disability can occur at birth or at any point in a person's life.
By age —
- 8 percent of children under 15 had a disability.
- 21 percent of people 15 and older had a disability.
- 17 percent of people 21 to 64 had a disability.
- 50 percent of adults 65 and older had a disability.
Source: Americans with Disabilities: 2010 www.census.gov/prod/2012pubs/p70-131.pdf
20%
Percentage of females with a disability, compared with 17 percent of males.
Source: Americans with Disabilities: 2010 www.census.gov/prod/2012pubs/p70-131.pdf
Where They Live
19%
Percent of the civilian noninstitutionalized population in West Virginia with a disability ─ the highest rate of any state in the nation. Utah, at 9 percent, had the lowest rate.
Source: 2012 American Community Survey, Table R1810
http://factfinder2.census.gov/faces/tableservices/jsf/pages/productview.xhtml?pid=ACS_12_1YR_R1810.US01PRF&prodType=table
30%
Percent of the civilian noninstitutionalized population in Pike County, Ky., with a disability ─ the highest rate in the nation among counties with populations of 65,000 or more. Arlington County, Va., at 5 percent, had among the lowest rates.
Source: 2012 American Community Survey, Table GCT1810http://factfinder2.census.gov/faces/tableservices/jsf/pages/productview.xhtml?pid=ACS_12_1YR_GCT1810.US05PR&prodType=table
23%
Percent of the civilian noninstitutionalized population in Lorain, Ohio, with a disability ─ among the highest rates in the nation among places with populations of 65,000 or more. Weston, Fla., at 3 percent, had among the lowest rates.
Source: 2012 American Community Survey, Table GCT1810http://factfinder2.census.gov/faces/tableservices/jsf/pages/productview.xhtml?pid=ACS_12_1YR_GCT1810.US13PR&prodType=table
Specific Disabilities
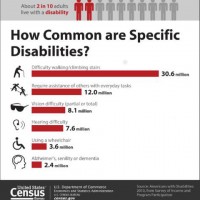
7.6 million
Number of people 15 and older who had a hearing impairment. Among people 65 and older, 4 million had hearing impairments.
Source: Americans with Disabilities: 2010 www.census.gov/prod/2012pubs/p70-131.pdf
8.1 million
Number of people 15 and older with a vision impairment.
Source: Americans with Disabilities: 2010 www.census.gov/prod/2012pubs/p70-131.pdf
30.6 million
Number of people 15 and older who had movement impairment, such as walking or climbing stairs.
Source: Americans with Disabilities: 2010 www.census.gov/prod/2012pubs/p70-131.pdf
3.6 million
Number of people 15 and older who used a wheelchair. This compares with 11.6 million people who used canes, crutches or walkers.
Source: Americans with Disabilities: 2010 www.census.gov/prod/2012pubs/p70-131.pdf
2.4 million
Number of people 15 and older who had Alzheimer's disease, senility or any form of neurocognitive disorders.
Source: Americans with Disabilities: 2010 www.census.gov/prod/2012pubs/p70-131.pdf
12.0 million
Number of people 15 and older who required the assistance of others in order to perform one or more basic or instrumental activities of daily living, such as bathing, dressing, doing housework and preparing meals.
Source: Americans with Disabilities: 2010 www.census.gov/prod/2012pubs/p70-131.pdf
Earnings and Poverty
$20,184
Median earnings in the past 12 months for people with a disability. This is 66 percent of the median earnings,$30,660, for those without a disability.
Source: 2012 American Community Survey, Table B18140
http://factfinder2.census.gov/faces/tableservices/jsf/pages/productview.xhtml?pid=ACS_12_1YR_B18140&prodType=table
323,000
Number of employed people with disabilities earning $100,000 or more annually. This amounts to 4 percent of all people with disabilities who were employed. In comparison, 8 percent of all people without a disability who were employed earned $100,000 or more annually.
Source: Disability Employment Tabulation, from 2008-2010 American Community Survey, Table Set 7Ahttp://www.census.gov/people/disabilityemptab/data/
23%
Percentage of people with a disability who were in poverty. By comparison, those without a disability had a poverty rate of 15 percent.
Source: 2012 American Community Survey, Table B18130
http://factfinder2.census.gov/faces/tableservices/jsf/pages/productview.xhtml?pid=ACS_12_1YR_B18130&prodType=table
Government Assistance
30%
Percentage of people who received income-based government assistance and have a disability; 18 percent of assistance recipients had difficulty walking or climbing stairs.
Source: Disability Characteristics of Income-Based Government Assistance Recipients in the United States: 2011 (from American Community Survey)
http://www.census.gov/prod/2013pubs/acsbr11-12.pdf
42%
The percentage of income-based assistance recipients in West Virginia with a disability, which led all states. Arizona ranked the lowest, at 25 percent.
Source: Disability Characteristics of Income-Based Government Assistance Recipients in the United States: 2011 (from American Community Survey) http://www.census.gov/prod/2013pubs/acsbr11-12.pdf
Health Insurance
10%
Percentage of people with a disability who lacked health insurance. Those without a disability were more likely to be without coverage (15 percent).
Source: 2012 American Community Survey, Table B18135
http://factfinder2.census.gov/faces/tableservices/jsf/pages/productview.xhtml?pid=ACS_12_1YR_B18135&prodType=table


