


By the Numbers: African-American History Month


- Details
- Published on Monday, 30 January 2017 14:16
- Written by The Peorian
To commemorate and celebrate the contributions to our nation made by people of African descent, American historian Carter G. Woodson established Black History Week. The first celebration occurred on Feb. 12, 1926. For many years, the second week of February was set aside for this celebration to coincide with the birthdays of abolitionist/editor Frederick Douglass and Abraham Lincoln.
In 1976, as part of the nation's bicentennial, the week was expanded to a month. Since then, U.S. presidents have proclaimed February as National African-American History Month.
Note: The reference to the black population in this publication is to single-race black people ("black alone") except in the first section on "Population." In that section, the reference is to black alone or in combination with other races, a reference to respondents who said they were one race (black) or more than one race (black plus other races).
Population
46.3 million: The black population, either alone or in combination with one or more other races, on July 1, 2015, up about 1.3 percent from July 1, 2014.
Source: Vintage 2015 Population Estimates, Table PEPALL5N
74.5 million: The projected black population, either alone or in combination, of the United States (including those of more than one race) on July 1, 2060. On that date, according to the projection, the black population would constitute 17.9 percent of the nation's total population.
Source: 2014 National Population Projections, Table 10
3.8 million: The black population in New York on July 1, 2015; the largest of any state or equivalent. Texas had the largest numeric increase since July 1, 2014 (94,000). The District of Columbia had the highest percentage (50.0 percent), followed by Mississippi (38.3 percent).
Source: Vintage 2015 Population Estimates
1.3 million: The black population in Cook County, Ill. (Chicago), in 2015; the largest of any county. Harris County, Texas, had the largest numeric increase since 2014 (22,200) and Claiborne County, Miss., was the county with the highest percentage in the nation (85.1 percent).
Source: Vintage 2015 Population Estimates
Businesses
108,473: The estimated number of black-owned employer firms in 2014.
Source: 2014 Annual Survey of Entrepreneurs, Table SE1400CSA01
31,216: The estimated number of black-owned health care and social assistance firms, the largest sector of black-owned businesses. The health care and social assistance sector is followed by professional, scientific and technical support (15,078) and administrative, support, waste management and remediation services (9,644).
Source: 2014 Annual Survey of Entrepreneurs, Table SE1400CSA01
Serving Our Nation
2.2 million: The number of black military veterans in the United States in 2015.
Source: 2015 American Community Survey, Table C21001B
Education
84.7%: The percentage of the black population age 25 and over with a high school diploma or higher in 2015.
Source: 2015 American Community Survey, Table S0201
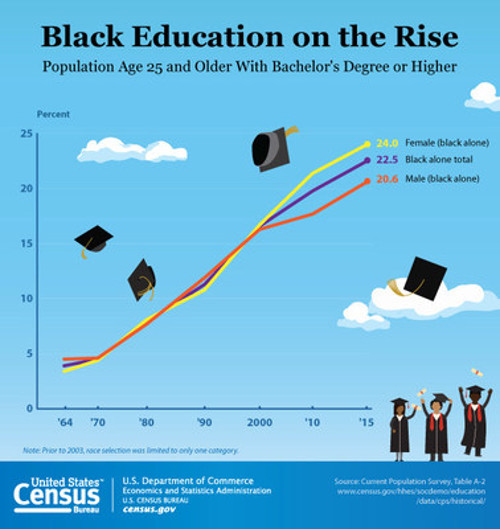
20.2%: The percentage of the black population age 25 and over with a bachelor's degree or higher in 2015.
Source: 2015 American Community Survey, Table S0201
1.9 million: The number of black people age 25 and over that attained an advanced degree in 2015.
Source: 2015 American Community Survey, Table B15002B
2.8 million: The number of black people enrolled in undergraduate college in 2015.
Source: 2015 American Community Survey, Table B14007B
Voting
11.1 million: The number of black people who voted in the 2014 congressional election.
Source: 2014 Current Population Survey, Table 2
17.8 million: The number of black people who voted in the 2012 presidential election. In comparison to the 2008 election, about 1.7 million additional black voters reported going to the polls in 2012.
Source: The Diversifying Electorate — Voting Rates by Race and Hispanic Origin
66.2%:The percentage of the black population who voted in the 2012 presidential election, higher than the 64.1 percent of the non-Hispanic white population who did so. This marks the first time that the black population voted at a higher rate than the white population since the Census Bureau started publishing statistics on voting by the eligible citizen population in 1996.
Source: The Diversifying Electorate — Voting Rates by Race and Hispanic Origin 2012
Income, Poverty and Health Insurance
$36,544: The annual median income of black households in 2015, compared with the nation at $55,775.
Source: 2015 American Community Survey, Table S1903
25.4%: The percentage of the black population below the poverty level in 2015, while nationally it was 14.7 percent.
Source: 2015 American Community Survey, Table S1701
88.9%: The percentage of the black population with health insurance for all or part of 2015. Nationally, the percentage of people with health insurance was 90.9 in 2015.
Source: Current Population Survey, 2016 Annual Social and Economic Supplement, Table HI-01
Families and Children
59.5%: The percentage of households with a black householder who had at least one relative present in 2016. There were 9.8 million black family households.
Source: 2016 Current Population Survey, Families and Living Arrangements, Table H1
45.1%: The percentage of families with black householders that were married couples in 2016.
Source: 2016 Current Population Survey, Families and Living Arrangements, Table H1
1.3 million: The number of black grandparents who lived with their own grandchildren younger than age 18 in 2015. Of this number, 42.4 percent were also responsible for their care.
Source: 2015 American Community Survey, Table B10051B
Jobs
28.7%: The percentage of the civilian employed black population age 16 and over who worked in management, business, science and arts occupations, while 37.1 percent of the total civilian employed population worked in these occupations.
Source: 2015 American Community Survey, Table S0201