Percentage of people moving falls to an all-time low

- Details
- Published on Monday, 21 November 2016 13:46
- Written by PRNewswire

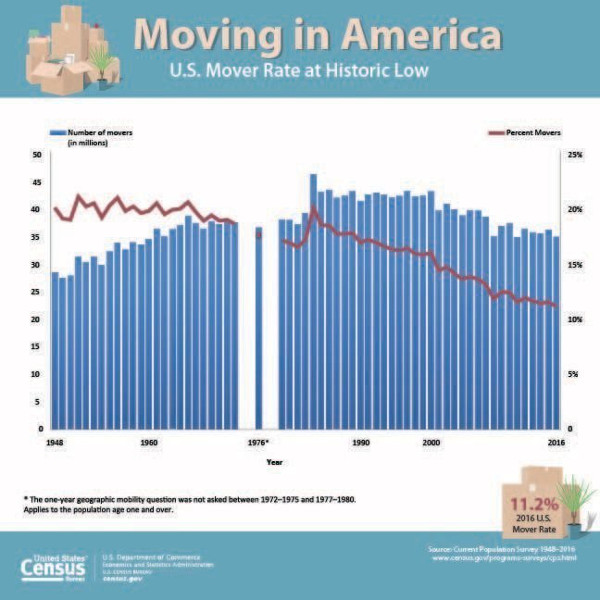
The percentage of Americans moving over a one-year period fell to an all-time low in the United States, to 11.2 percent in 2016, according to tables released by the U.S. Census Bureau.
"People in the United States are still moving, just not to the same extent as they did in the past," said David Ihrkesaid, a survey statistician in the Journey-to-Work and Migration Statistics Branch. "The decision to move can be personal and contextual. What causes one person to move might not be enough to convince another."
Among those who moved, 42.2 percent said they moved for a housing-related reason, such as wanting a new or better home/apartment. In comparison, 27.4 percent said they moved for a family-related reason, 20.2 percent said they moved for an employment-related reason, and 10.2 percent said they moved for some other reason.
Among regions, the South saw the greatest number of people moving out (901,000), but also saw the largest inflow of people moving into the region (940,000). The inflows and outflows of the region are not statistically different from each other.
The highest mover rates by race were for the black or African-American alone population (13.8 percent) and the Asian alone population (13.4 percent). These two mover rates were not statistically different. The white alone population moved at a rate of 10.3 percent. The Hispanic or Latino population (12.6 percent) were more mobile than the non-Hispanic white population (9.8 percent).
These latest statistics come from Geographical Mobility: 2015 to 2016, a collection of national- and regional-level tables from the Current Population Survey Annual Social and Economic Supplement. The tables describe the movement of people in the United States, including type of move, reason for moving and characteristics of those who moved during the past year. Distance moved is also available for people who moved to a different county or state. Also released were updated historical tables and graphs on migration with some statistics extending as far back as 1948.
Also available are 2015 American Community Survey state-to-state and place of birth flows and 2010-2014 American Community Survey county-to-county and metro-to-metro flows statistics. The county-to-county and metro-to-metro migration flows tables, which use data collected between 2010 and 2014, show how many residents move (or flow) from one county or metro area to another over a one-year period.
Among the 2015 American Community Survey state-to-state and place of birth flows:
- New York had 69,289 migrants to Florida, and California had 65,546 migrants to Texas. The state flows are not statistically different from each other.
- More than 1.5 million people living in Florida were born in New York. This was the largest flow between state of birth and state of current residence followed by more than 900,000 people who were born in New York living in New Jersey.
Highlights from the migration flows from the 2010-2014 American Community Survey:
- Approximately 16.9 million people moved annually to a different county, and nearly another 1.9 million people moved to the United States from abroad.
- The two largest county migration flows were Los Angeles County to Orange County in California with 41,558 movers and Los Angeles County to San Bernardino County in California with 39,865 movers. The two largest county-to-county flows do not differ statistically from each other.
- Among metro areas, in California, the Los Angeles-Long Beach-Anaheim metro area had 87,565 movers go to the Riverside-San Bernardino-Ontario metro area.
In addition to new data tables, the Census Flows Mapper tool now includes statistics from the 2010-2014 American Community Survey to show demographic statistics on the mover's relationship to the householder, household type and housing tenure. In addition, the 2010-2014 migration flow statistics are available through the Census Application Program Interface (API).
